All products
Land and ecosystems
Vegetation change analysis
Where is the land greening, and where is it losing ground?
Validated in
Arequipa, Peru
Maps from a finished run
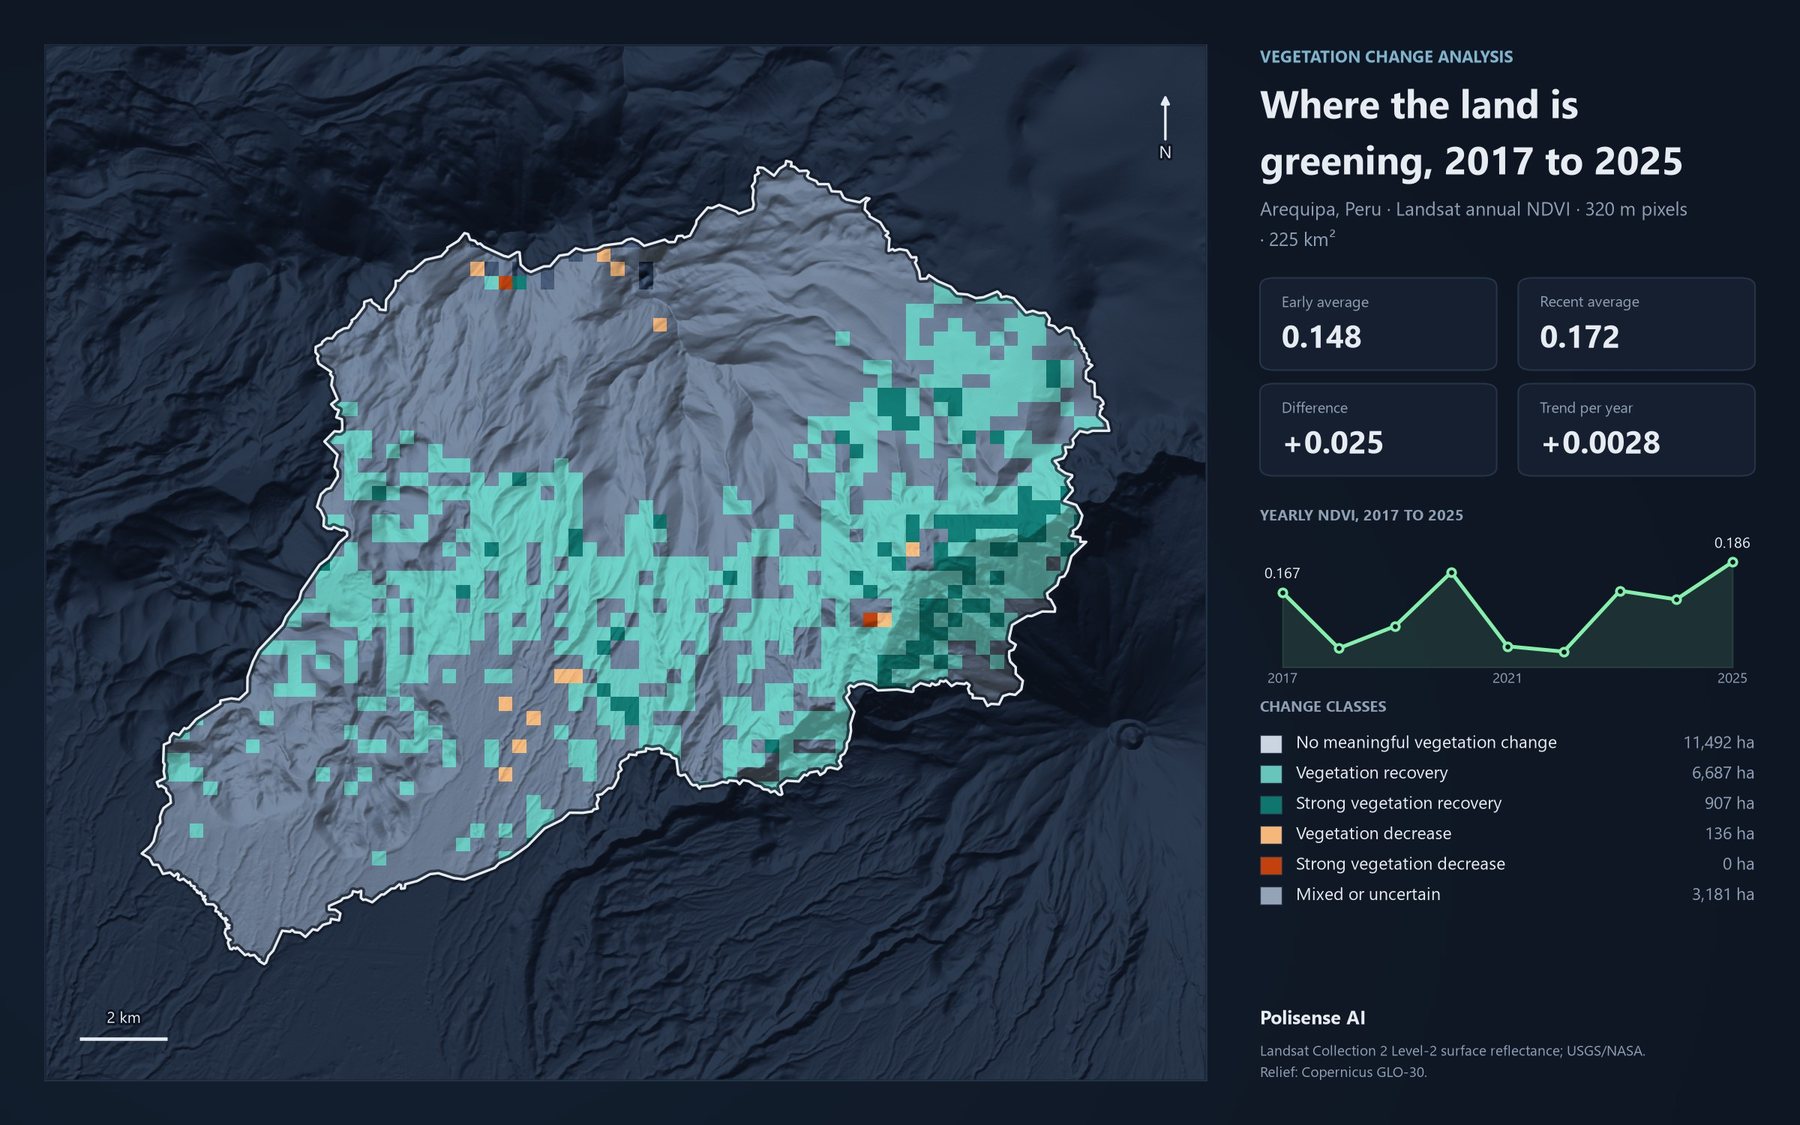
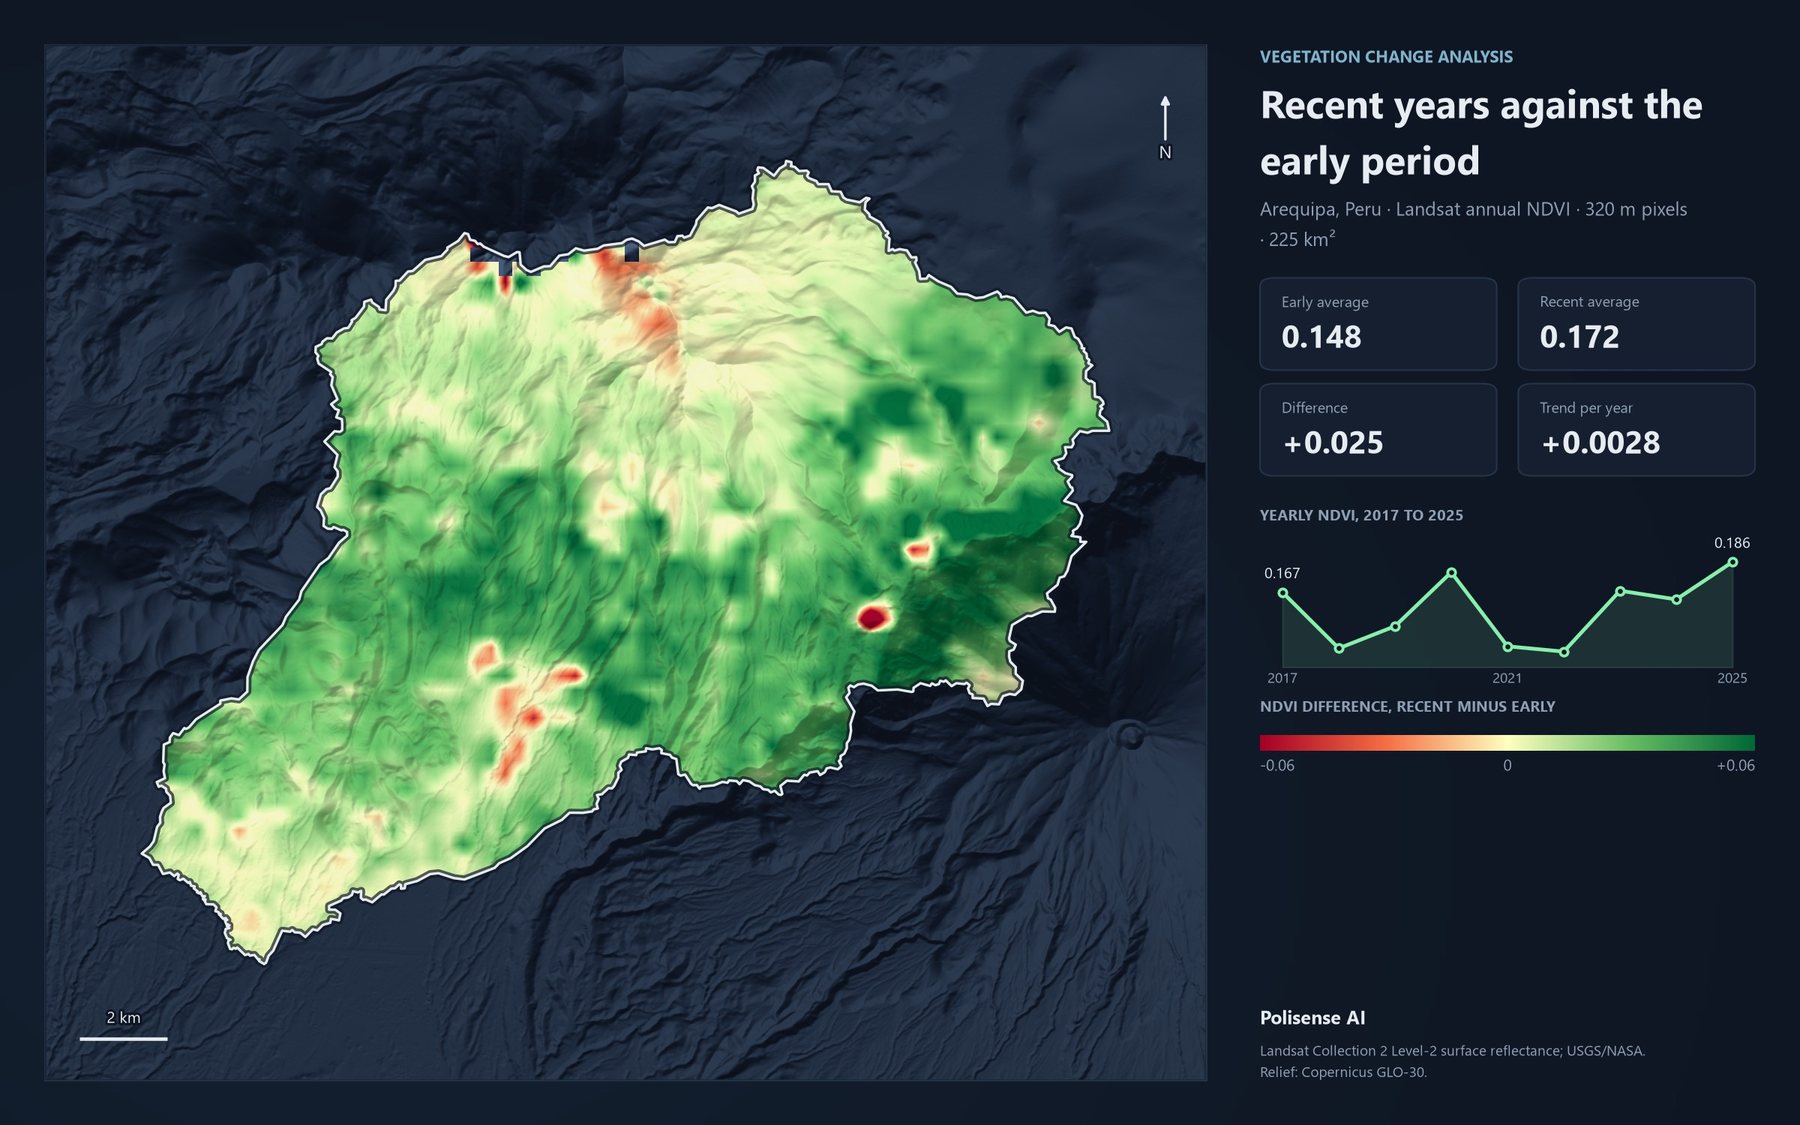
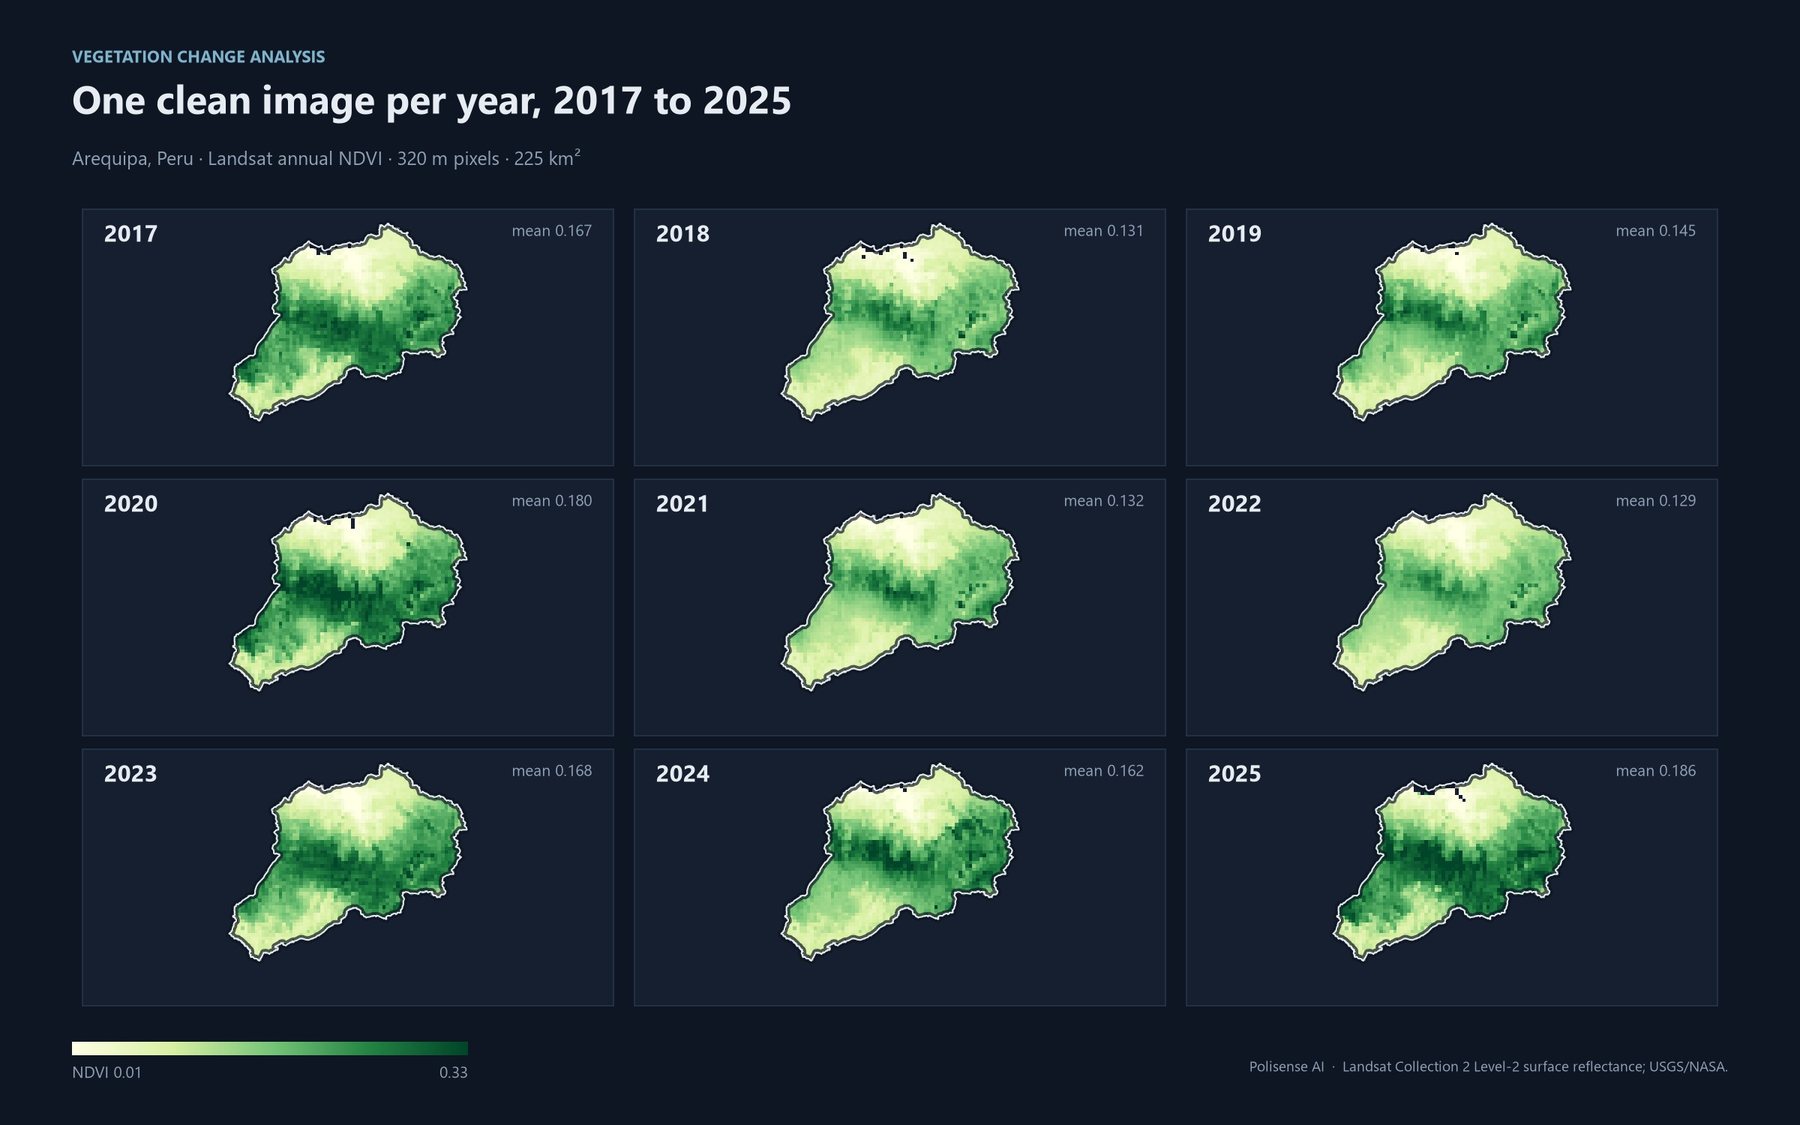
Results
- Show a recovery signal in a 225 km² watershed near Arequipa (2017-2025) whose average looked stable
- 6,687 ha
- Show a recovery signal in a 225 km² watershed near Arequipa (2017-2025) whose average looked stable
- Show a decrease signal in the same watershed, with 9 of 9 years of usable satellite data
- 136 ha
- Show a decrease signal in the same watershed, with 9 of 9 years of usable satellite data
What it does
- Upload your area and ask in the chat.
- Approve the plan. Nothing runs before you do.
- One clean image per year, early period against recent.
- Explore six map views of the change.
- Rank areas by change and download the results.
Six ways to read the change
Change classes
Change heatmap
Vegetation by year
Long-term trend
Data quality
Review grid
- Runs only after you approve the plan
- Every result shows its data quality
- Built on USGS/NASA Landsat and Google Earth Engine
Try it on your own territory
Live, on a real question from your region.