Skip to content
All products

Agriculture

Farmer early warning

Which farming areas need a warning first when the weather turns?

Validated in

Bangladesh

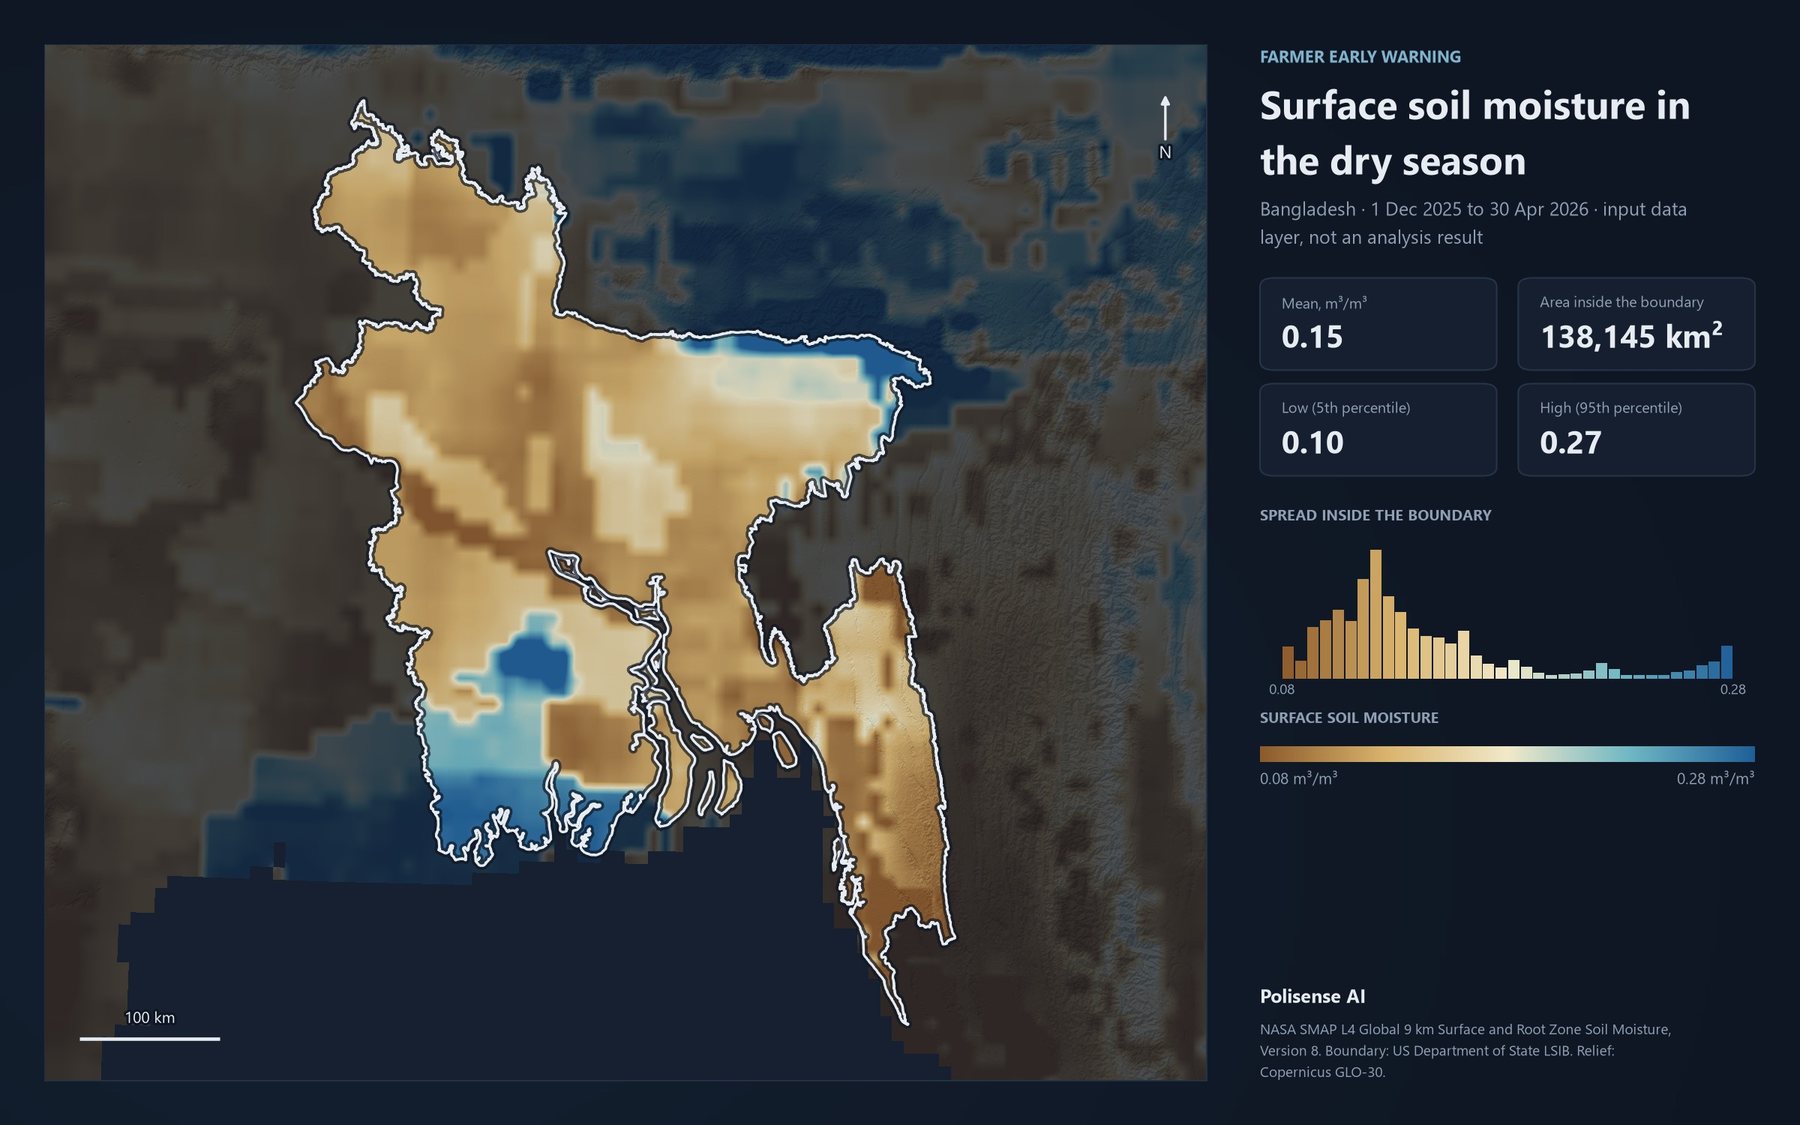
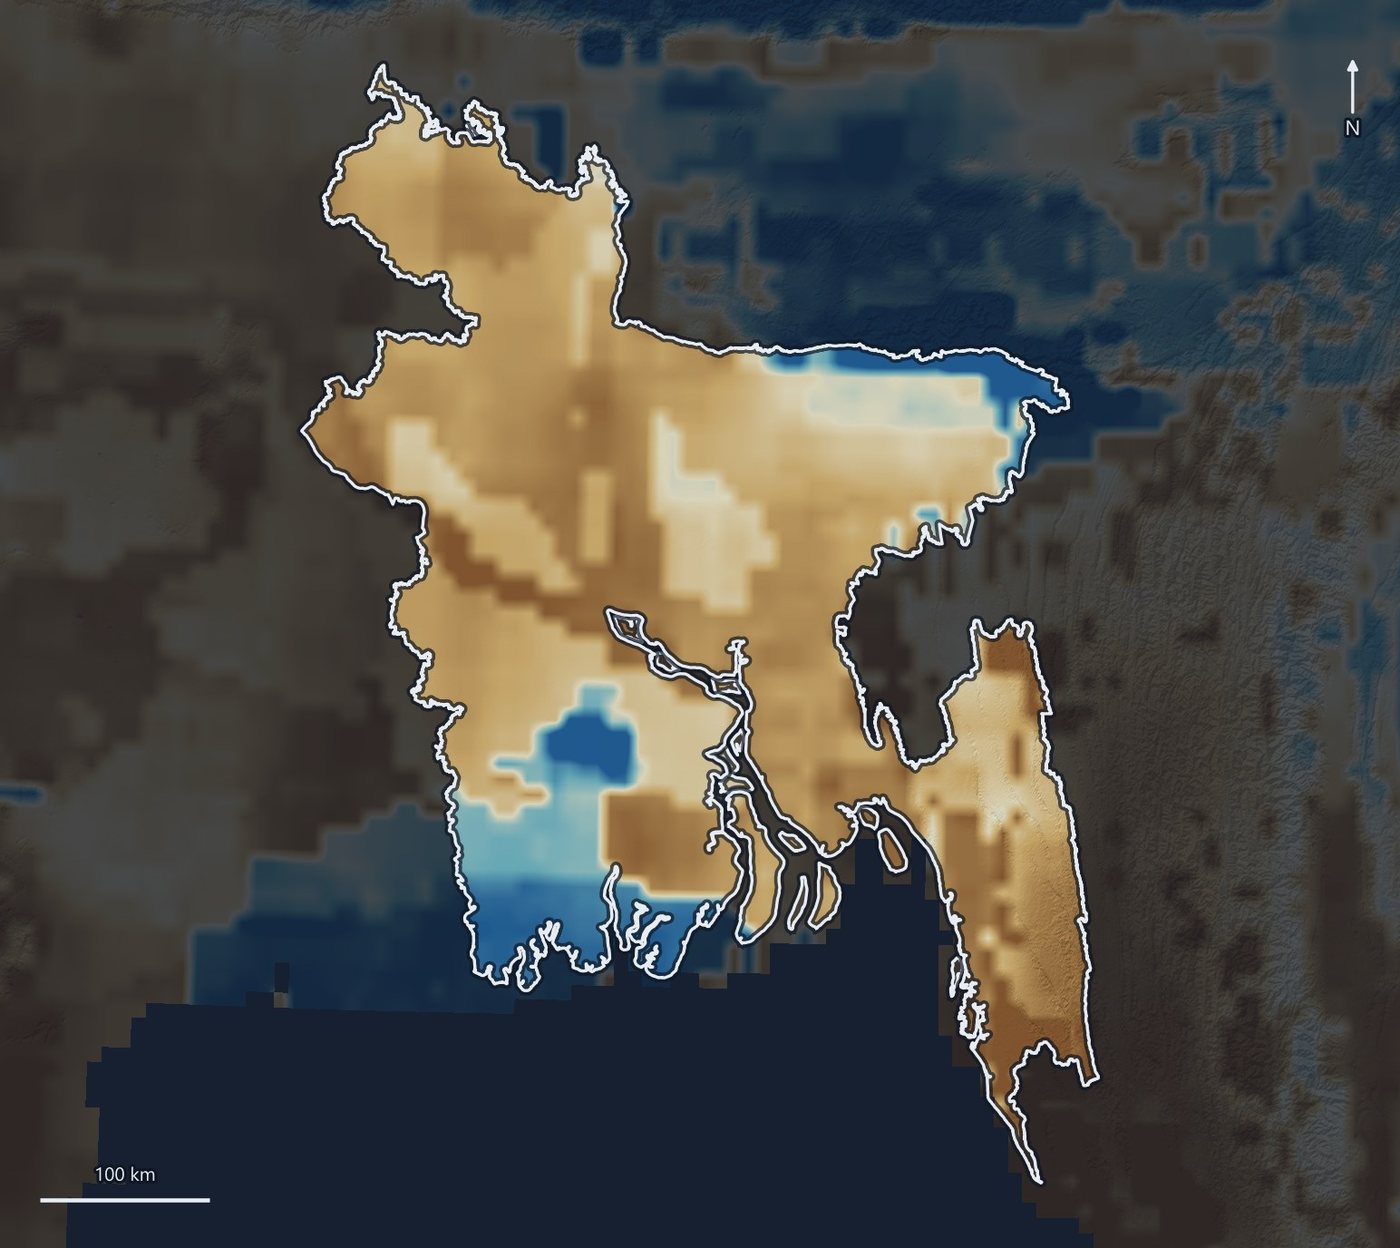
Map of Bangladesh coloured by surface soil moisture in the dry season, drier in the north-west and wetter in the north-east wetlands and the south-west coast.

Data the analysis reads

Map of Bangladesh coloured by surface soil moisture, with the mean, the 5th and 95th percentiles and a histogram of values inside the country.
Surface soil moisture, 1 Dec 2025 to 30 Apr 2026. NASA SMAP L4, 9 km. Input data, not an analysis result.
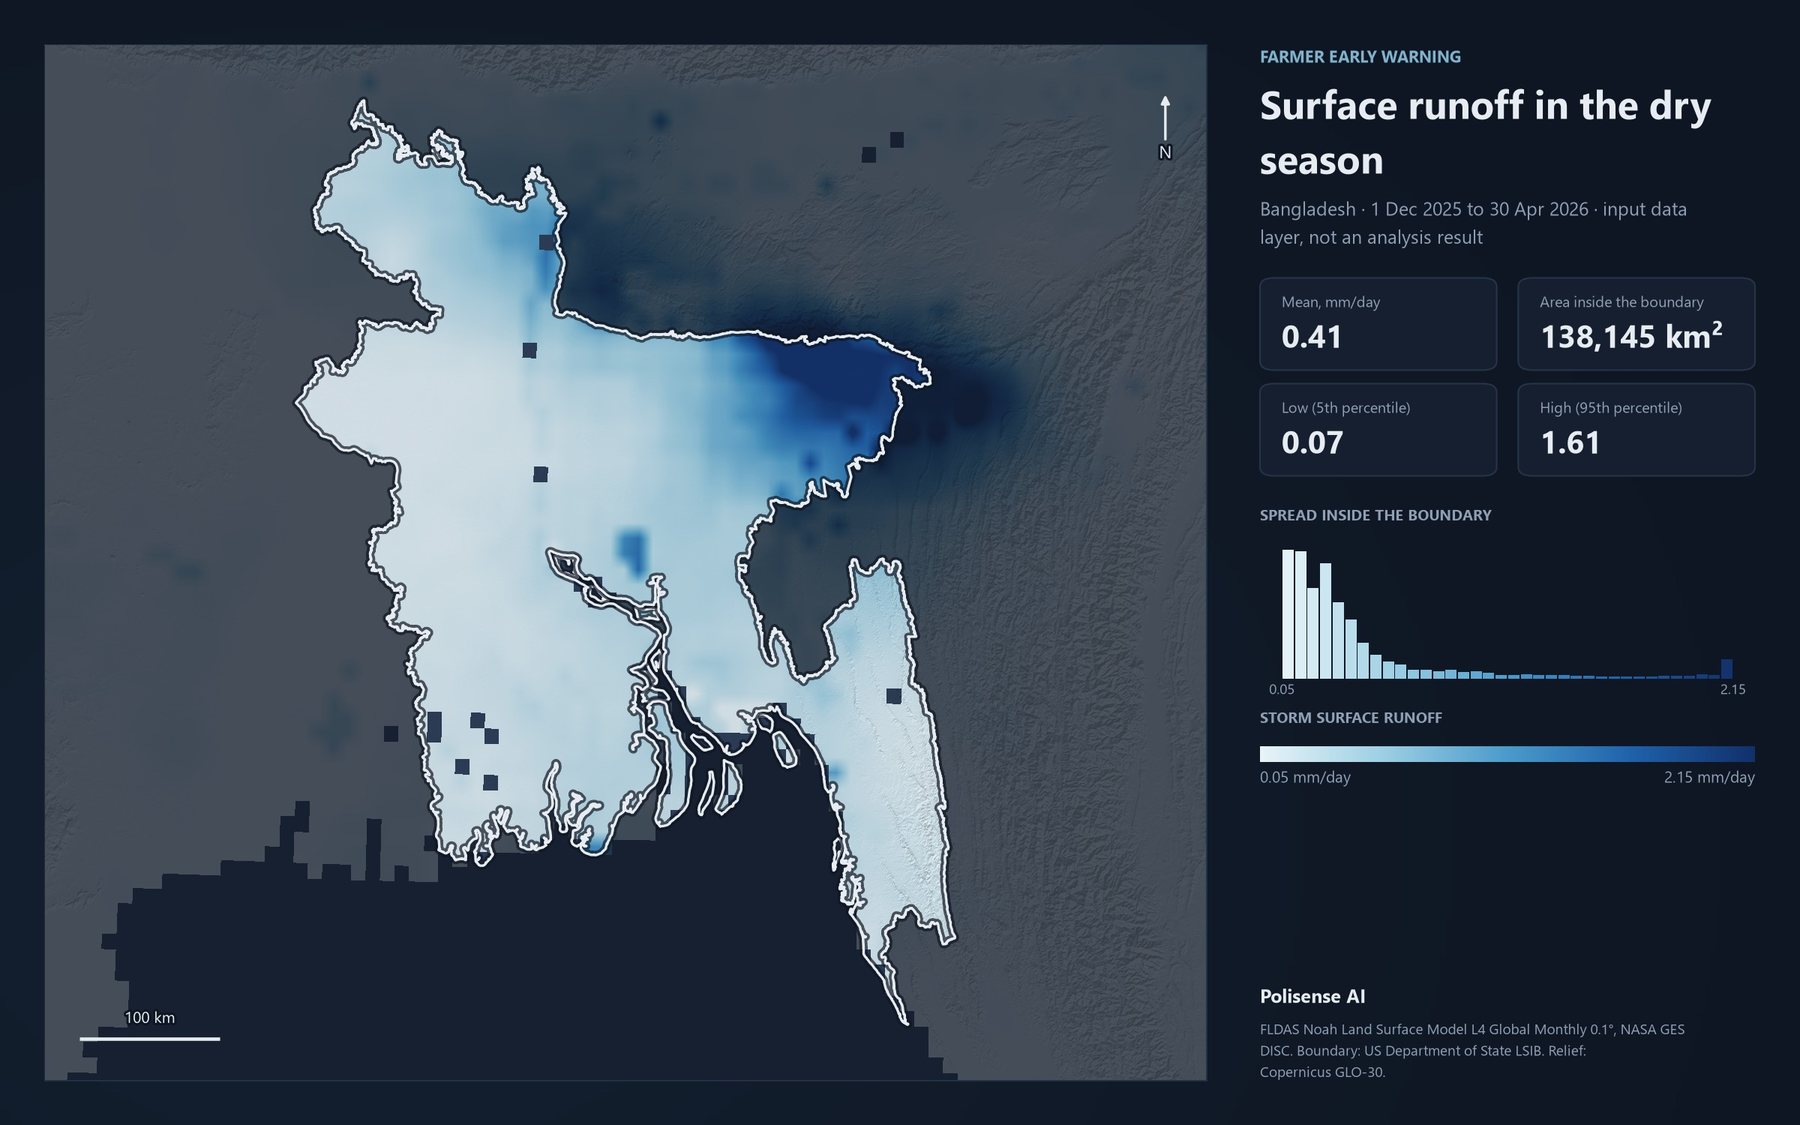
Map of Bangladesh coloured by surface runoff in the dry season, low across most of the country and highest in the north-east.
Storm surface runoff, same season. FLDAS Noah land surface model, 0.1°. Input data, not an analysis result.
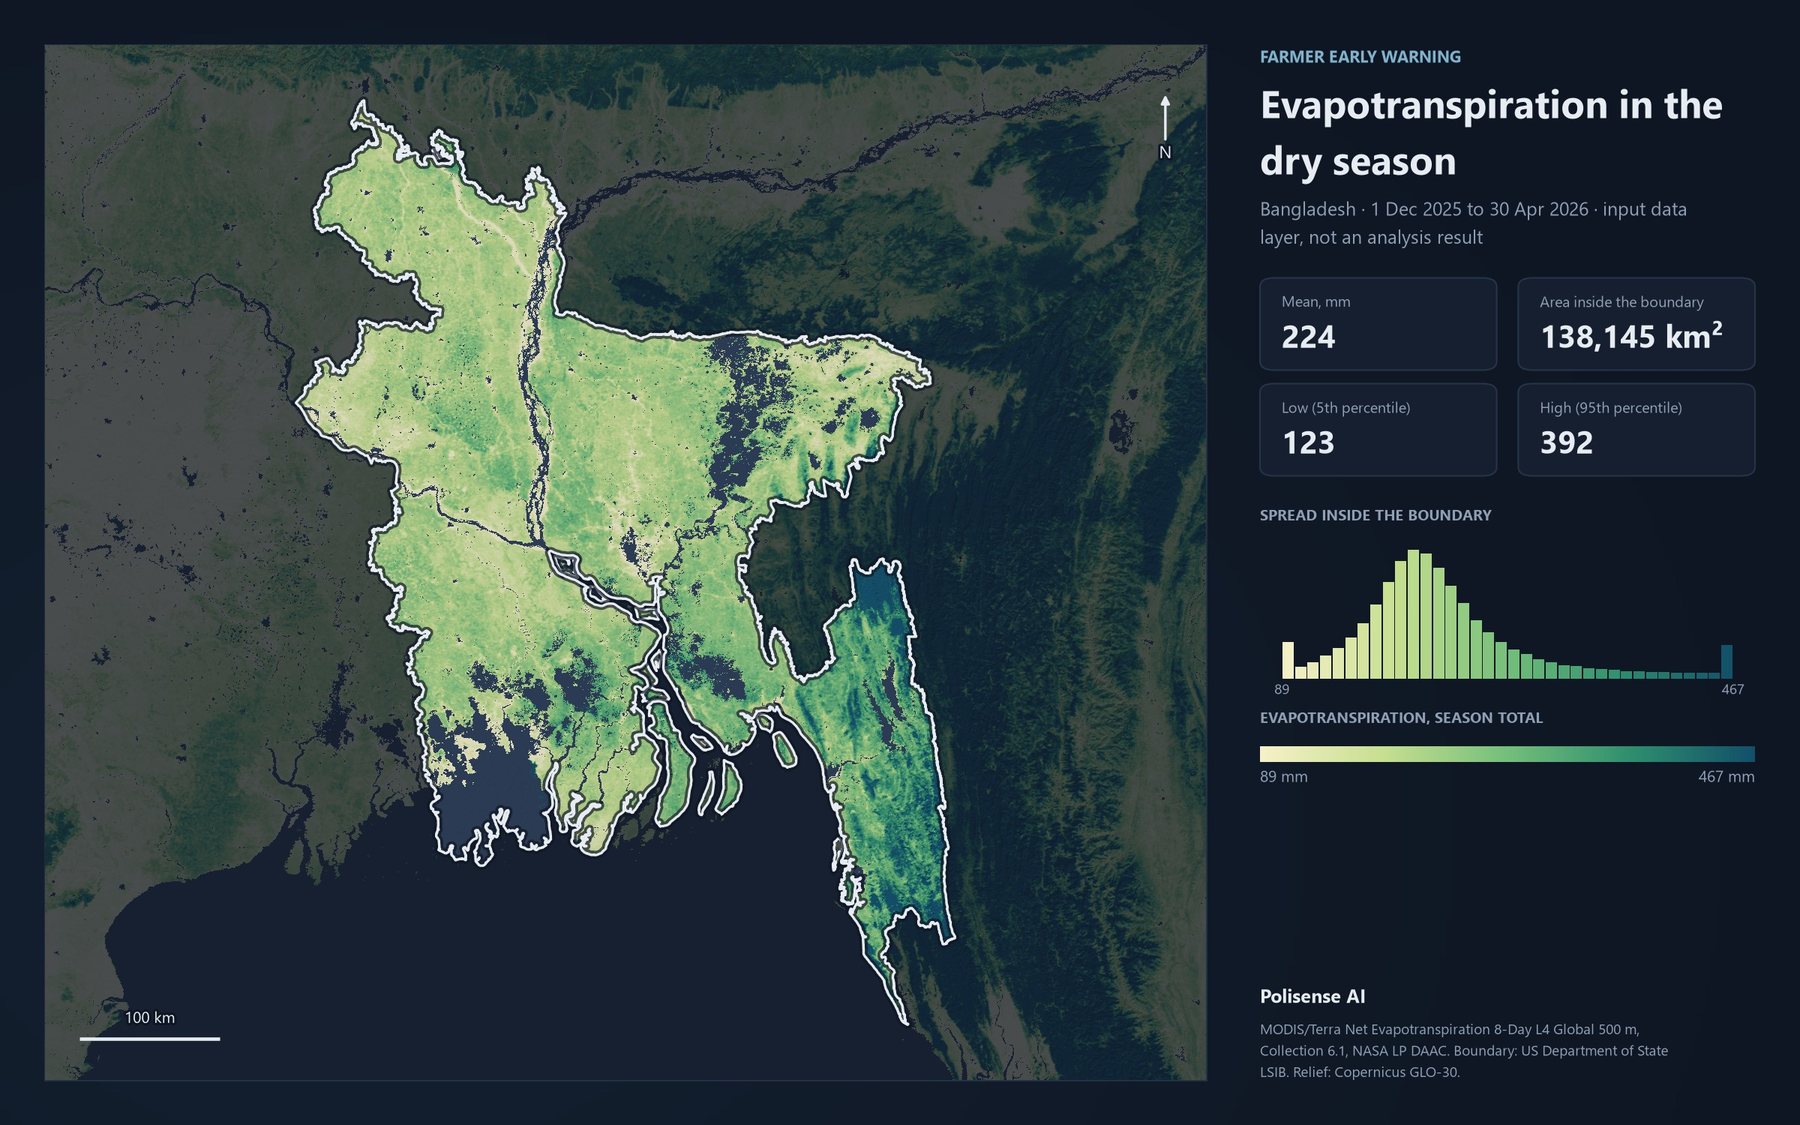
Map of Bangladesh coloured by total evapotranspiration over the dry season at 500 m, highest in the forested south-east hills.
Evapotranspiration, season total. MODIS/Terra MOD16A2, 500 m. Input data, not an analysis result.

What it does

  1. Combines historical and projected weather with farmland and settlement data.
  2. Scores exposure area by area.
  3. Ranks where to warn and intervene first, with the reasoning attached.

Try it on your own territory

Live, on a real question from your region.