All products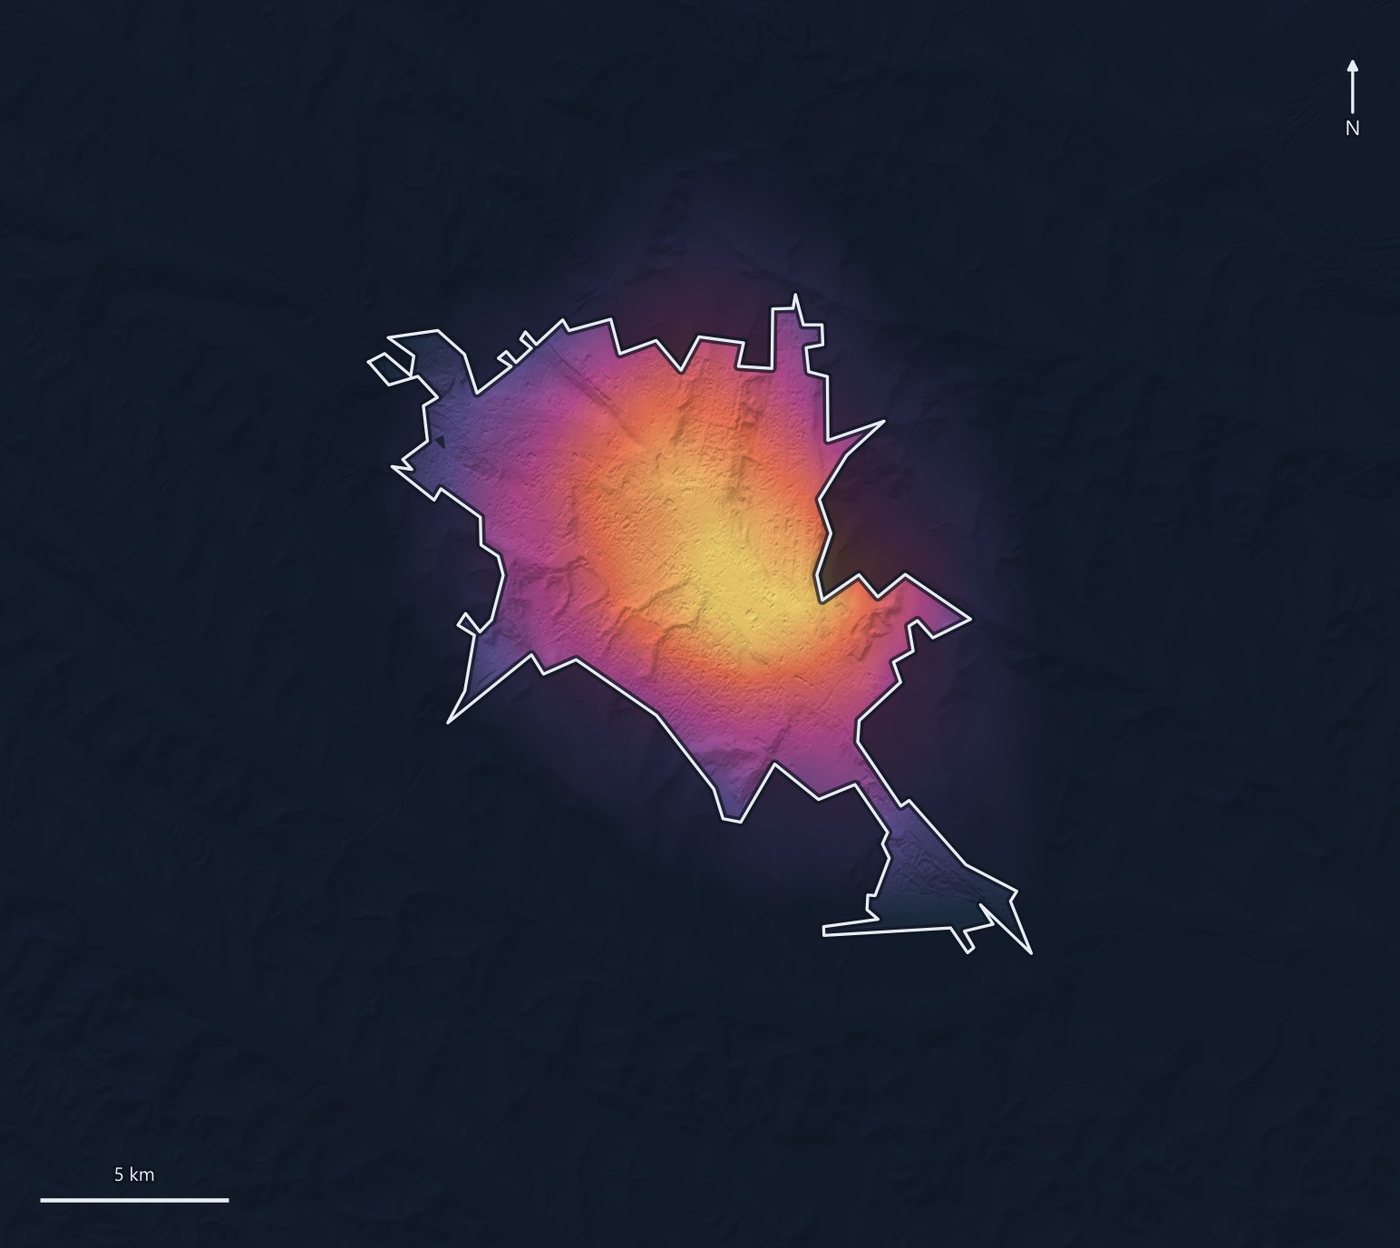
Air quality
Air-quality sensor placement
Where should a city put a limited number of air-quality sensors?
Validated in
Chișinău, Moldova
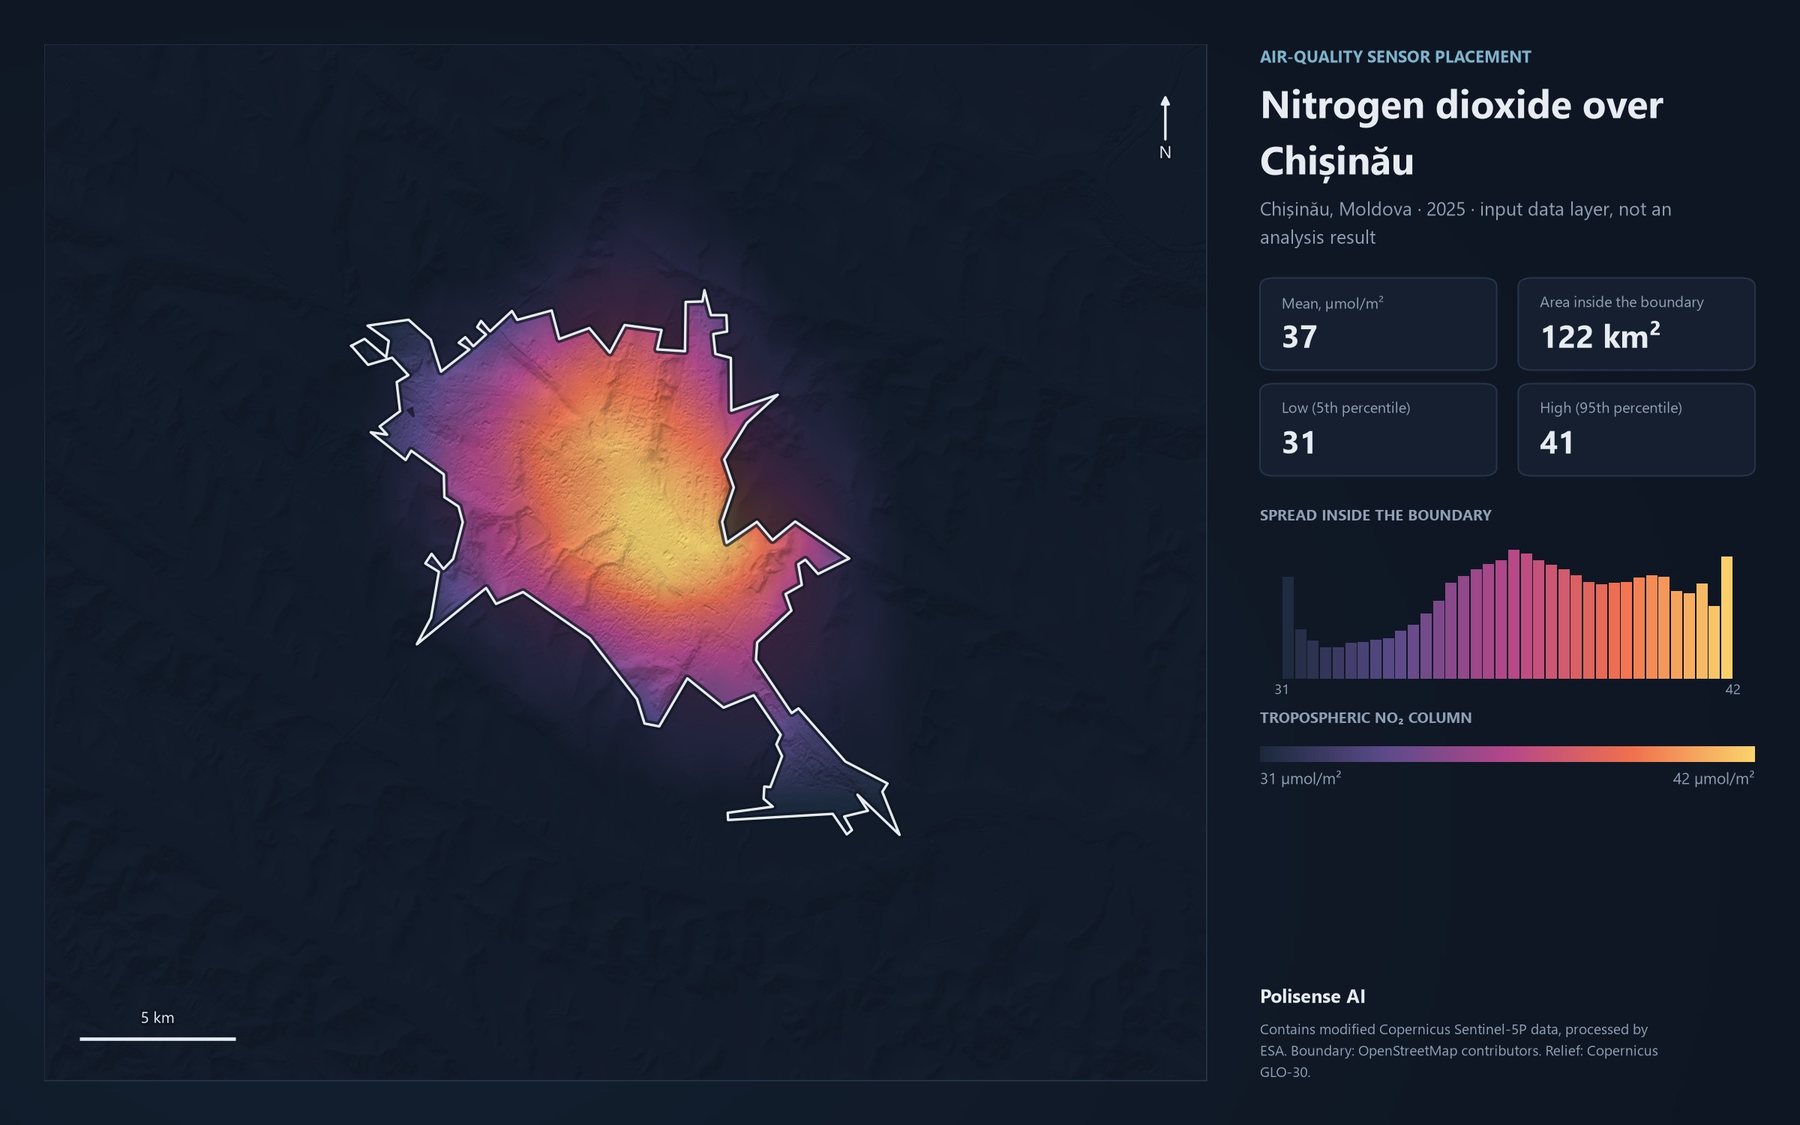
Data the analysis reads
What it does
- Maps population density alongside emission sources and road networks.
- Scores candidate locations on the coverage they would add.
- Ranks placements for the size of network the city can afford.
Try it on your own territory
Live, on a real question from your region.